Cloudiness
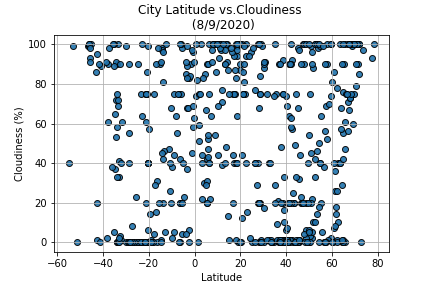
The graph is analyzing the cloudiness percent as you move away from the equator. The southern hemisphere tends to be cloudier this time of year that the northern hemisphere. This may be due to the tilt of the earth at the time of year this data was gathered and the higher temperatures the more south you go.